Marks & Spencer success in the gin-famous case against Aldi
Charlotte Ginnaw



It is a truism of travel that to get the best value you go where the locals go; and eat where the locals eat. The same applies in other fields too.
The chart below shows for the first eight months of the Unitary Patent (‘UP’) system, percentage uptake of the UP by applicants from various countries.
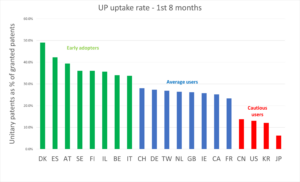
This shows significant variation, with Chinese, US, Korean and Japanese applicants being among the least adventurous and the Danes and Spanish (!) most enthusiastic.
As the country with most patent grants in this period, it is worth looking in more detail at the USA.
From the first nine months figures, US proprietors appear more risk averse than the rest of the world, with around half the uptake rate for the unitary patent and twice the opt-out rate.
| 1st 9 months | Total | % of grants | USA | % of grants | Rest of World | % of grants |
| Granted EP patents | 99,444 | 24,043 | 75,401 | |||
| UP | 23,044 | 23% | 3,474 | 14% | 19,570 | 26% |
| Opted-out | 3,928 | 4% | 1,436 | 6% | 2,492 | 3% |
| Ratio UP/opt-out | 5.9 | 2.4 | 7.9 |
Given that the fragmented nature of Europe has been a constant source of complaint from the USA, what is the reason for their reluctance to use the UP?
Is there a historian in the house who can advise what happened to state patents after 1790?
Jim Boff (Fellow)
Charlotte Ginnaw
Matt Dixon
Jim Boff
Patent Examination Board
Lord Chris Smith, Chair of IPReg
Lee Davies
IPO update
Matt Dixon
Jim Boff
Rachel Free
Charlotte Ginnaw
Claire Jacques
Beck Greener LLP
David Pearce, Barker Brettell LLP
Bristows
EIP
Bird & Bird LLP
Vicky Maynard
Ruth Collins
Andrea Brewster OBE
Emily Jones
Patent Examination Board
Epseeta Chowdhury
Informals Committee
Daniel Hurst, Lucy Sharples
Becca Allen
Epseeta Chowdhury