Marks & Spencer success in the gin-famous case against Aldi
Charlotte Ginnaw



The Chartered Institute of Patent Attorneys (‘CIPA’) represents virtually all of the UK’s 2,700 registered patent attorneys in industry and private practice. We are the UK’s largest intellectual property (‘IP’) organisation with over 4,500 members, including 1,100 trainee patent attorneys. It is our members that support British SMEs, universities and large companies in protecting their innovative technology worldwide. The reputation of the UK for IP advice draws work from around the world; only 11% of European patent applications by British representatives are for UK applicants. Consequently, the profession generates around £1 billion for the economy in gross value added and approaching £750 million in exports.
CIPA supports the Society of Chemical Industry (‘SCI’) Manifesto for an Industrial Science & Innovation Strategy. In particular, we support the call for a Science & Innovation Growth Council to ensure science industrialisation is at the heart of government policy. We believe that a representative of CIPA could usefully sit on this Council to provide guidance on patent protection, particularly for SME business. We note that the Manifesto does not mention patents, but we have been invited by SCI to provide our perspective. The remainder of this document provides information on the patenting activities of British applicants and the issues that we see.
Since 2016, British applicants file more US patent applications than UK patent applications. Canada is the only other major country in the world that files more patent applications in the USA than it does at its national patent office. The decline in UK patent applications is not a result of British applicants choosing the EPO route for UK protection, as evidenced by the relatively modest growth in EPO filings. British businesses are choosing not to file UK patent applications.
The same trends are not seen in the patent filing activity of French and German applicants, as shown in the following charts.
In general, the number of applications filed by French and German applicants at their national patent offices have remained flat over most of the last 20 years, with only a significant drop in 2020 and 2021, presumably as an effect of the global pandemic. French applicants have shown a similar increase in US and Chinese filings to that of the UK but have increased EPO filings at twice the rate of the UK. For German applicants the rate of increase in US filings is lower than that for the UK and there is a similar rate of increase of EPO filings, but the increase in Chinese filings is the largest of all three countries at 540%.
In the WIPO Global Innovation Index 2023,[1] the United Kingdom is ranked fourth overall after Switzerland, Sweden and the United States. This is very encouraging. The UK scores positively in relation to the quality of its universities, its use of information technology, its environmental performance and the output of its creative industries. However, the areas in which the UK is ranked significantly behind all three of the leading countries are:
It is striking that on every measure in the WIPO report that explicitly mentions patents, the UK is significantly behind each of Switzerland, Sweden and the USA (and France and Germany).
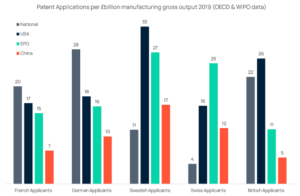
The lower level of patent filing relative to GDP in the UK could be attributed to the relatively large size of the service economy in the UK. However, over the last 20 years British manufacturing output has increased by at least 40%[11]. CIPA has conducted its own research to scale patent filing figures to the size of the manufacturing economy (see chart below[12]). This shows that the UK rate of filing US patent applications is the second highest of these five countries (after Switzerland). However, for both the EPO and China, the UK rate of filing is the lowest in this group of countries. The rates of British patent filings in China and the European Patent Office are 20% to 40% behind that of our neighbours France and Germany, even when normalised for the relative size of the manufacturing economy. The relatively low level of national patent applications in Sweden and Switzerland can be attributed to the use of the EPO, rather than the national office, for first patent filings.
Internationally, the USA, China and the EPC countries represent 80% of British export markets by value,[13] as shown in the table below. This is not dissimilar to the situation in Germany and France, yet British companies are behind in protecting their inventions in the EPO and China.
| 2022 export value US$bn | United Kingdom | Germany | France | |||
| USA | 64 | 13% | 165 | 10% | 49 | 8% |
| China & Hong Kong | 59 | 12% | 120 | 7% | 30 | 5% |
| AT BE CH DE ES FR GB IE IT NL | 231 | 46% | 696 | 43% | 332 | 55% |
| Other EPC | 47 | 9% | 397 | 24% | 81 | 13% |
| Rest of World | 104 | 21% | 255 | 16% | 111 | 18% |
| TOTAL | 506 | 100% | 1,633 | 100% | 603 | 100% |
There is clearly an opportunity to improve the standing of the UK in world innovation by increasing business use of the international patent system.
Research shows that companies, including SMEs, that own patents have 36% higher revenues and pay 53% higher wages than those that do not own registered IP rights.[14] Technology businesses need patent attorneys to protect their technology effectively, because only 4% of unrepresented UK patent applications actually get granted.[15]
The Intellectual Property Office (‘IPO’) has policy and research teams dedicated to improving the overall environment for business and supporting UK research development and innovation. Research by economists and analysts at the IPO confirms that many British businesses are not filing patents outside the UK, with one third (34%) of all patent families with UK applicants including only UK protection[16].
One of the main strengths of the IPO’s policy making function is the close link with the rights granting services, so policy is informed by evidence based on direct, practical experience. However, when it comes to patent protection in countries outside the UK, the IPO does not have that direct practical experience.
We think the UK government and the IPO needs external support from experts such as our members to help British businesses achieve strong international patent protection, in ways that go beyond the services that the IPO itself can offer.
There is no representative body in the UK for SME patent owners who are developing and commercialising technology. The IP Federation represents large patent holders, and PraxisAuril represents university technology transfer. We think that CIPA can bridge this gap because it is our members that are providing the support to practically every British SME that is developing and patenting technology. We want to use our experience of SME technology development and commercialisation to help the government develop innovation policy. We think that our knowledge of the real challenges faced by SMEs commercialising technology can inform practical solutions.
As an example of a practical solution, the French patent office subsidises an EPO search for first filings,[17] so that French SMEs can get to an international patent application for about £1,500. The same thing costs British applicants over £3,000. We understand that some UK searches are already being subcontracted to the EPO. Could the IPO allow applicants to choose an EPO search?
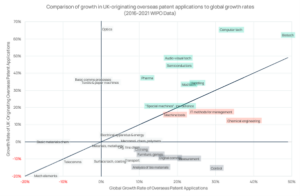
As shown in the chart below, there are fields, such as biotechnology, computer technology, audio-visual technology, medical technology, semiconductors, pharmaceuticals, handling (logistics) and defence in which the UK growth rate of overseas patent applications is higher than the equivalent global growth rate. These are fields where British applicants are leading international competitors in seeking protection.
There are other fields, such as machine tools, IT management methods and chemical engineering, in which the global growth rate of overseas patent applications is relatively high, suggesting a developing field, but the UK growth rate is behind the global growth rate. These are fields in which UK businesses could be supported in their global patent filing strategies.
Taking machine tools as an example field, the list below shows all the UK applicants for international patent applications under the Patent Co-operation Treaty that were published in 2022 (the number of published applications is in brackets).
Element Six (UK) Ltd (6), Jaguar Land Rover Ltd (6), Dynomec Ltd (3), Cummins Ltd (2), Precision Robotics Ltd (2), BAE Systems Plc (1),
Renishaw Plc (1), Rolls Royce Smr Ltd (1), Acutension Ltd (1),
Aeristech Ltd (1), Alpha Assembly Solutions Inc (1), Aquasium Tech Ltd (1), Atlas Copco IAS Uk Ltd (1), Avdel UK Ltd (1), C4 Carbides Ltd (1),
Carl Kammerling International Ltd (1), Chemring Energetics UK Ltd (1),
Conex IPR Ltd (1), Crafti Tech Ltd (1), Decom Engineering (1),
Epoch Wires Ltd (1), Flexiv Ltd (1), Flowtech International Ltd (1),
Hampshire Design Solutions Ltd (1), HS Products Ltd (1),
Kenwood Ltd (1), Lead Tech Ltd (1), LNT Solutions Ltd (1), Loowatt Ltd (1), Pillarhouse International Ltd (1), Pipeflex Systems Ltd (1),
RTL Materials Ltd (1), Scribemaster Ltd (1), Texture Jet Ltd (1),
Trumpf Laser UK Ltd (1), WDurston Ltd (1), Zeeko Innovations Ltd (1).
Some of these names are well-known as major British manufacturing companies, but many are not. For example, Dynomec Ltd is based in Castleford, West Yorkshire and makes and sells a locking wheel nut remover. They have three international patent applications relating to this technology and several granted patents. Decom Engineering in Belfast and Aberdeen specialises in industry leading pipe cutting and pipe coating removal to provide optimised decommissioning solutions that are greener, faster and more versatile. Only about a third of the published international applications in this field are by the large, well-known companies. The majority of patent activity is by SMEs. This pattern of SME activity will be seen in other growth technical fields.
The European Patent Office has published a helpful ‘Deep Tech Finder’[18] which combines patent and financial data to identify investment-ready European start-ups with patent applications at the EPO. This shows 1,795 such companies in the UK.
British businesses are falling behind other European companies in the international patent protection of their technology. This problem requires a government strategy that goes beyond the services that the Intellectual Property Office can provide directly. We believe that CIPA can provide the support to government to address the issue, particularly in the context of SMEs.
Matt Dixon, CIPA President
[1]. https://www.wipo.int/edocs/pubdocs/en/wipo-pub-2000-2023-en-main-report-global-innovation-index-2023-16th-edition.pdf
[2]. Number of patent families filed in at least two offices (per billion PPP$ GDP) | 2019.
Source: World Intellectual Property Organization, Intellectual Property Statistics (www.wipo.int/ipstats); and International Monetary Fund, World Economic Outlook Database, October 2022 (www.imf.org/en/Publications/WEO/weo-database/2022/ October). Data year: 2019.
[3]. Gross expenditure on R&D financed by business enterprises as a percentage of total gross expenditure on R&D. For the definition of GERD, see indicator 2.3.2.
Source: UNESCO Institute for Statistics (UIS) online database (http://data.uis.unesco.org); Eurostat database (https://ec.europa.eu/eurostat/data/database); OECD, Main Science and Technology Indicators (MSTI) database (https://stats.oecd.org/Index. aspx?DataSetCode=MSTI_PUB); and Ibero-American and Inter-American Network of Science and Technology Indicators (RICYT) (www.ricyt.org/en/). Data years: 2013–2022.
[4]. Gross expenditure on R&D performed by business enterprises as a percentage of GDP.
Source: see above.
[5]. Index that measures the likelihood and severity of political, legal, operational or security risks affecting business operations. Scores are annualised, standardised and aggregated for end Q1, Q2, Q3 and Q4.
Source: S&P Global, Market Intelligence, Country Risk Dataset (www.marketplace. spglobal.com/en/datasets/country-risk-(255)). Data year: 2022.
[6]. Index that reflects perceptions of the quality of public services, the quality of the civil service and the degree of its independence from political pressures, the quality of policy formulation and implementation, and the credibility of the government’s commitment to such policies. Scores are standardised. Source: World Bank, Worldwide Governance Indicators (http://info.worldbank.org/ governance/wgi). Data year: 2021.
[7]. The extent to which governments ensure a stable policy environment for doing business. Average answer to the survey question: In your country, to what extent does the government ensure a stable policy environment for doing business? [1 = not at all; 7 = to a great extent].
Source: World Economic Forum, Executive Opinion Survey 2022 (www.weforum.org).
Data years: 2018–2022.
[8]. Growth rate of real GDP per person employed, average of five most recent available years (2017–2021).Source: The Conference Board Total Economy DatabaseTM, April 2023 (www.conference-board.org/data/economydatabase). Data years: 2020–2022.
[9]. Number of resident patent applications filed at a given national or regional patent office (per billion PPP$ GDP). A resident patent application refers to an application filed with an IP office for or on behalf of the first-named applicant’s country of residence. For example, an application filed with the Japan Patent Office by a resident of Japan is to be considered a resident application for Japan. Similarly, an application filed with the European Patent Office (EPO) by an applicant who resides in any of the EPO member states (for example, Germany) is a resident application for that member state (Germany). Source: see footnote 1, Data years: 2014–2021.
[10]. Number of Patent Cooperation Treaty (PCT) applications (per billion PPP$ GDP). The origin of PCT applications is defined by the residence of the first-named applicant.
Source: see footnote 1, Data years: 2021–2022.
[11]. stats.oecd.org/Index.aspx?DataSetCode=STANI4_2020
[12]. https://www3.wipo.int/ipstats/ips-search/patent https://stats.oecd.org/Index.aspx
?DataSetCode=STANI4_2020#
[13]. https://tradingeconomics.com/united-kingdom/exports-by-country
[14]. https://www.epo.org/news-events/news/2021/20210208.html
[15]. https://thoughts.boult.com/post/102gu2k/96-of-self-represented-patent-applications-at-the-ukipo-do-not-get-granted
[16]16. www.gov.uk/government/publications/analysing-the-global-filing-activities-of-uk-patent-applicants
[17]. https://www.inpi.fr/comprendre-la-propriete-intellectuelle/le-brevet/combien-coute-un-brevet
[18]. https://datavisualisation.apps.epo.org/datav/public/dashboard-frontend/
host_epoorg.html#/explore?dataSet=1
Charlotte Ginnaw
Matt Dixon
Jim Boff
Patent Examination Board
Lord Chris Smith, Chair of IPReg
Lee Davies
IPO update
Matt Dixon
Jim Boff
Rachel Free
Charlotte Ginnaw
Claire Jacques
Beck Greener LLP
David Pearce, Barker Brettell LLP
Bristows
EIP
Bird & Bird LLP
Vicky Maynard
Ruth Collins
Andrea Brewster OBE
Emily Jones
Patent Examination Board
Epseeta Chowdhury
Informals Committee
Daniel Hurst, Lucy Sharples
Becca Allen
Epseeta Chowdhury